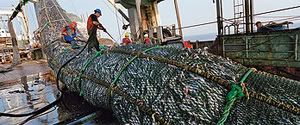
photo credit Jean Gaumy & Magnum Photos
A new study published last week measures different country's "SeafoodPrints" around the world. Think of it like a carbon footprint, only with seafood production instead of carbon production.
"How do you measure the "SeafoodPrint" of a country, you ask? By factoring in the type of fish and the total amount hauled in. The researchers used a unit of measurement based on "primary production," the microscopic organisms at the bottom of the marine food web that are required to make a pound of a given type of fish."
Clever. And needed - I might add. We've been hearing a lot about how fish stocks are declining worldwide. The ocean is in just as much trouble as the rest of the planet - if not more.
China wins (if you want to call it that) first place for its massive SeafoodPrint based on population size. Peru comes in second due to its large anchoveta fishery that provides feed for livestock and farmed fish worldwide. Guess who's number three? The United States - for its terrible choices in preferring top predators like tuna, salmon and swordfish.
"As Dr. Pauly told the Washington Post, "A pound of tuna represents roughly a hundred times the footprint of a pound of sardines.""
So what should we do?
"We could think about reducing our [seafood] footprint like we're thinking of reducing carbon emissions," says National Geographic fellow Enric Sala.
Want more information on choosing sustainable seafood? Check out this post for some great tools, or just stop by your local Whole Foods Market and follow their handy labeling system.
Full articles here (Oceana & The Washington Post)
No comments:
Post a Comment